| ABSTRACT | ||||||||||||||||||||||
| The concept of nano-reinforcement with layered silicates, which was introduced by researchers at the Toyota Central Research Laboratories (Japan), has become very popular recently. The ongoing R&D interest in this type of reinforcement is mostly due to the unexpected property improvements when the silicates are dispersed on nanometer scale. The dispersion of the fillers and curatives is very important, as it is one of the dominant factors in determining the overall properties of the material. Additionally, the overall behaviour of the nanocomposites is governed by the curing mechanism, and this can be elucidated by exploring the curing kinetics.
Two different types of modified clay based on Montmorrillonite, Nanofill® 5 modified with di-methyl-dihydrogenated tallow alkyl quaternary ammonium and Nanoclay® 682616 modified with octadecylamine, were added to natural rubber and cured by a conventional vulcanization system. The filler loading was varied from 0-15 phr to investigate the influence on processing and properties. For the kinetic curing studies, a compound with 10 phr clay loading was used.
X-ray diffraction (XRD) studies indicated, that the basal spacing of the clay minerals was increased for the NR-MMT nanocomposites. The dynamic mechanical analysis using a strain sweep mode showed that the Payne effect decreases due to an improved dispersion of carbon black induced by the presence of nanoclay. A rheometric study showed interesting results: a faster curing rate for nanoclay and a lower torque due to a plasticisation effect of the modifier which was used for clay modification. The changes in hardness and tensile strength were smaller than expected for the addition of a nanofiller.
Rheometric studies disclosed some significant details about the cure kinetics: the activation energy of the vulcanization process is reduced by the presence of modified nanoclays, indicating an easier crosslinking of clay containing compounds. In addition, it was revealed that the quaternary ammonium compounds contained as modifier in the clay, shows a plasticization effect. Due to the positive results obtained in this and similar studies, further research on this field should be encouraged. Additional research on the curing kinetics of the nanoclay filled rubber compounds is crucial for the development of the nanoclay technology and its full potential for applications in rubber nanocomposites. |
||||||||||||||||||||||
| 1.GENERAL INTRODUCTION | ||||||||||||||||||||||
| Over the past few years, nano-engineered polymeric materials became one of the rapidly growing new groups of materials as alternatives to the conventionally filled polymers and polymer blends. The growing interest in these materials has mainly been triggered by the overproportionally enhanced properties they impose on the materials. The most striking effect of this new type of fillers in polymeric nanocomposites is their ability to significantly improve their overall properties while allowing reducing the total filler loadings. [1] For elastomeric materials, a good dispersion of the filler is the basic requirement to achieve the optimum reinforcement and the best property profile. Carbon black has widely been used as filler in the rubber industry for many decades, but for the past 10 to 15 years the major interest was concentrated on silica. In the recent past, nanostructured fillers such as carbon nanotubes are also evaluated for elastomer applications.Significant improvements are achieved with these filler materials in thermoplastics; however, their application in elastomers is still a challenge. The mixing process remains a complicated and difficult issue. This creates problems in controlling aggregation and agglomeration of filler particles, dispersion and filler-matrix interactions. Various methods including surface modification, grafting and use of different compatibilizing agents are currently being studied to overcome these problems. [1] Surface modification with surfactants is essential for nanoclays in order to achieve an optimal homogenous dispersion of the filler. For the surface modification of clay, a range of unique chemistries implying enhanced thermal stability and high affinity to elastomers are utilised. The modification of clay can be done through ion exchange of interlayer cations with organic surfactants. The cation exchange capacity (CEC) of the clay is a very important factor for producing nanocomposites as it determines the required amount of the surfactant that can be intercalated between the silicate layers. [2] Alkyl amine surfactants are generally used as organic surfactants. The length of the alkyl chain and the number of alkyl tails on the surfactant molecules directly affect the ion exchange reaction. A large number of surface treated nanoclays are commercially available these days. [1], [2] Incorporating nano-fillers into rubbery materials to obtain favourable mechanical and physical properties has been a primary task for many researchers and industries [3]. Most of this research is focused on the effect of these particular filler as partial or complete replacement of conventional fillers on the performance of the nanocomposites. However, cure kinetics and processing behaviour are equally important in determining the final properties of a composite material. Most of the mechanical properties of rubber compounds are related to the type and degree of vulcanization, besides the type and amount of filler. Multiple and complex reactions involved in vulcanization of the rubber compounds, which might be influenced by the presence of fillers, can lead to variations in physicomechanical properties. The actual mechanism of vulcanization and its effect on mechanical properties can only be revealed by a study of the curing reaction and its kinetics. [4] 1.1.Research Objectives The aim of this research is as follows: i) Study of the effect of nanoclay loading on the properties of natural rubber nanocomposites ii) Study of the curing kinetics and activation energy for different clay/natural rubber (NR) nanocomposites 1.2.Scope of the Study This thesis addresses the fundamentals of rubber nanocomposites along with modification and application of nanoclay for elastomer nanocomposites. It evaluates the processing and property variations related to nanoclay addition in terms of curing kinetics, activation energy measurements and mechanical properties. Two different organically modified montmorillonite (MMT) clays were selected as fillers in addition to carbon black; the nanocomposites were prepared using natural rubber as matrix. They were processed by successively using an internal mixer, an open two roll mill and a compression moulding machine. Cure characteristics were determined by a Moving Die Rheometer (MDR), and an Advanced Polymer Analyser (APA-2000) from Alpha Technologies. The obtained cure characteristics were studied and analysed further to determine the activation energy. Tensile testing was performed in order to study the mechanical properties of the material, as well as hardness tests. |
||||||||||||||||||||||
| 2. THEORETICAL BACKGROUND | ||||||||||||||||||||||
| Polymer-clay nanocomposites were first reported in the early 1950. However, carbon black technology for elastomers is used for more than a century, and carbon black as well as other typical reinforcing fillers for rubber are also nano-scaled materials. A remarkable attention for these structures was created after Toyota researchers introduced intercalated ε-caprolactam-clay nanocomposites [5]. In recent years, polymer-clay nanocomposites have drawn increasing interest from both, industry and academia, due to the significant improvements of material properties at very low clay loadings. [2, 6] The outstanding reinforcement potential of nanofillers in composites is primarily based on the high aspect ratios of the nanofillers [7]. Although tremendous research activities are done in the field of polymer-clay nanocomposites for the last two decades, the elastomer-clay nanocomposites are still at the stage of infancy as far as their application is concerned. The major challenge in this regard is the degree of clay dispersion in the rubber matrix. The high viscosity of the rubber matrix makes distribution of any additives extremely challenging. [8] The colloidal state and surface chemistry of the layered silicate in a polymer matrix plays a vital role in nanocomposites formation. Electrostatic forces complicate the dispersion of the layered silicates in the polymer matrix [9]. The incompatibility between the hydrophilic silicate and the hydrophobic polymer results in strong interparticle forces and agglomeration. In order to achieve a better dispersion, the surface forces responsible for the layer stacking of the silicates should be weakened. This can be achieved by various kinds of modification treatments. For example, in some polymer matrices exfoliation can be achieved by organic modification of clay particles. [8] |
||||||||||||||||||||||
| 2.1. Clay | ||||||||||||||||||||||
| Clay is a cheap natural raw material that has been widely used for many years as filler for rubber and plastics; mainly for a reduction of the costs of the material. A majority of the clay minerals belongs to the category of layered silicates or phyllosilicates due to the arrangement of silica and alumina sheets in a certain proportional manner [10]. Clay is composed of silicate layers that are 1 nm thick and 200-300 nm wide in the lateral dimension [11]. The layered silicate structure of clay is generated by 2-D arrays of silicon-oxygen tetrahedral and aluminium- or magnesium-oxygen/hydroxyl octahedral units [12]. Clays are classified on the basis of their crystal structure and charge per basic cell. The stacking arrangement of tetrahedral (Th) and octahedral (Oh) sheets on top of each other can form two basic types of clay structure: ThOh or ThOhTh. The alternating arrangement of Th and Oh sheets in Figure 2-1A shows a 1:1 structure. A 1:1 layered structure (e.g. kaolinite) is formed when only a tetrahedral sheet is linked to an octahedral sheet, whereby the oxygen atoms are shared. Hydrogen bonds between -OH of one layer and a bridging -O- of the next layer are the main bonding forces in this kind of structure. The arrangement with repeating units of silica tetrahedral layers combined with one octahedron layer of alumina results in a 2:1 structure as given in Fig. 2-1B. [12-13] |
||||||||||||||||||||||
 |
||||||||||||||||||||||
| Figure 2-1. Schematic representation of the structure (A) type 1:1 clay (Kaolinite) and (B) type 2:1 clay ( Montmorillonite).[13] Different clay minerals can be used for polymer nanocomposites, which are presented in Table 2-1. |
||||||||||||||||||||||
| Table 2-1. Types of clay. [14] | ||||||||||||||||||||||
 |
||||||||||||||||||||||
| The most commonly used layered silicates for the preparation of polymer/layered silicate nanocomposites belong to the family of 2:1 phyllosilicates, in particular montmorillonite (MMT). The layer thickness is normally about 1 nm and the lateral dimensions of these layers can vary from 100 nm to several microns depending on the type of layered silicate. In MMT, the isomorphous substitution of Al3+ by Mg2+, Fe2+, etc. in the octahedral sheets results in a net negative charge in sandwiched layers. [8-12] | ||||||||||||||||||||||
| 2.1.1. Montmorillonite (MMT) Montmorillonite (MMT) clay, named after Montmorillon in France, belongs to the pyrophyllites, which is a member of the family of smectites. It has a general molecular formula of (Na,Ca)0.3(Al,Mg)2Si4O10(OH)2·nH2O. MMT is an environmentally friendly material and naturally abundant. The colour of MMT varies from brick red to pale yellow or blue grey and the CEC ratio ranges from 0.8 to 1.2 meq/g. Detailed properties are presented in Table 2-2. [15] The MMT used in this study is composed of a complicated assembly of oxides and organic residuesfrom the modification. The weak intermolecular force holds the oxygen atoms on top and base of the lattice layers of MMT; as a result water penetrates easily into the MMT structure. In this composition, some hydrated cations like Na+, K+, Ca2+, Mg2+, Al3+, H+, Li+, Cs+, Rb+ and NH4+ are exchangeable. The type of MMT is classified according to its exchangeable cation, and the degree of expansion of the intergallery space is determined by the category of these cations. [16, 17] |
||||||||||||||||||||||
| Table 2-2. Properties of Montmorillonite. [ 15] | ||||||||||||||||||||||
|
||||||||||||||||||||||
| The ideal dispersion of the layered silicate is realised if all the layers are sufficiently separated from each other in the polymer matrix. Normally, the space between two successive layers in MMT is too small to allow polymer molecules to penetrate into it. Organic modification, which enhances the gap between the layers, is one of the techniques that can be used to overcome this problem. In this method, the cations, which are present in the gallery, are replaced by some quaternary ammonium compounds with a long hydrophobic tail; for instance alkylammonium salts as shown in Figure 2-2. However, particularly in an elastomer matrix, organic modification itself is not sufficient to obtain intercalated or exfoliated structures. [8] |
||||||||||||||||||||||
| 2.1.2.Organoclay | ||||||||||||||||||||||
| Organoclay is the result of an organic modification of clay which is formed by exchanging the original interlayer cations for organocations. The organic cations lower the surface energy and improve wetting and intercalation by the polymer matrix, resulting in a larger interlayer spacing. The organic cations may provide functional groups that can react with monomers or polymers to enhance interfacial adhesion between the clay nanolayers and the polymer matrix. Generally, the organocations used for this purpose are quaternary alkylammonium ions. The modification will allow the formation of an organophilic surface in the clay structure. A frequently used method for prepration of organoclays is given by the general reaction: [20] where NaZ is montmorillonite with Na+ as interlayer cation, and R is the alkyl chain of the acidified primary amine surfactant. RNH3Z is the organoclay. Organic surfactants normally used to modify clay include primary, secondary, tertiary and quaternary alkylammonium cations, and they are water soluble. To obtain an organoclay, most cation exchange reactions are performed in aqueous suspension. Alkylammonium cations in organosilicates improve the wetting ability between the organoclay and the polymeric matrix by reducing the surface energy of the clay. This will result in a larger intergallery spacing which is dependent on the size of the organic cations for eg. alkylammonium cations which are used for modification. The unmodified MMT clay has the gallery spacing of the range 1.32 nm which on modification with quaternary ammonium modification increases to the range of 2.98 nm. [65] The cation exchange reaction is directly affected by the length of the alkyl chain and the number of alkyl tails on the surfactant molecules. [21] |
||||||||||||||||||||||
| 2.2. Rubber | ||||||||||||||||||||||
| Rubber consists of polymeric chains as shown in Figure 2-3, which are joined in a network structure and have a high degree of flexibility. Upon application of stress to a rubber material, such as stretching it, the polymer chain, which is randomly oriented,undergoes bond rotations allowing the chain to be extended or elongated. [22] | ||||||||||||||||||||||
 |
||||||||||||||||||||||
| Figure 2-3. A rubber polymeric chain (poly-isoprene). [22] The fact that the chains are joined in a network allows for elastomeric recoverability since the cross-linked chains cannot irreversibly slide over one another. [23] |
||||||||||||||||||||||
| 2.2.1. Behaviour of Rubber | ||||||||||||||||||||||
| The behaviour of rubber under loading is a complex phenomenon and is dependent on several factors including temperature and rate of application of force. The rubber elasticity is characterized by a very large deformation and extremely low modulus. Therefore, rubber can support very large deformations (e.g. stretching to five or ten times its original length) and then return to its original size. This elastic behaviour is strongly dependent on the temperature. A high mobility of the molecular segments in a polymer is the condition for the rubbery state. In a rubbery material this is combined with cross-linking of the molecular chains. With decreasing temperature, the movements of the segments are reduced. At a certain temperature level, movements of the molecular segments are completely frozen and it becomes a stiff, brittle, plastic-like material with low elongation at break. [22-25] Before vulcanization, elastomers act as high-viscosity fluids; they are elastic but also flow under stress. Changes in the viscoelastic properties of the rubber occur immediately upon the rubber being cooled down. Changes caused by crystallisation, however, need a certain time to develop and it can take a long time to reach equilibrium. [23] Rubbers are non-Newtonian pseudoplastic materials; hence the viscosity of rubber during mixing not only depends on the temperature but also on the shear rate and stress. The extent of the effect of the shear rate and temperature on the viscous properties of a rubber compound depends on the characteristics of the raw rubber. When shear rate and stresses are very small, an asymptotic zero shear viscosity ηo can be found which increases with higher average molecular weight. The distribution of the molecular weight affects the shape of the viscosity curve. [22-25] The temperature dependence of the viscosity of the rubber can be adequately described by Arrhenius like equation: [24] |
||||||||||||||||||||||
 |
||||||||||||||||||||||
| Where η is the viscosity, ηo is the viscosity at reference temperature To, ΔE is the activation energy of the flow and R is universal gas constant. The sensitivity of the rubber viscosity to changes in temperature strongly depends on the separation of the process temperature from the glass transition temperature Tg. Flow induced disentanglement of the rubber molecules is the primary source of substantial reduction of the viscosity during mixing which occurs as the strain rate is increased during mixing. Both, temperature and flow induced viscosity changes are reversible, but chain scission brings about a permanent change. Among all commercially available rubbers, natural rubber is the most susceptible to chain scission. A minimum rate of the chain scission is found at a temperature of around 100oC. Below this temperature, the rate increases due to mechanical chain scission whereas above this temperature, it increases due to oxidative chain scission. The addition of a chemical peptiser increases the scission rate in the oxidative region, and a physical peptiser reduces viscosity by a lubrication effect on the polymer chains. [22-26] |
||||||||||||||||||||||
 |
||||||||||||||||||||||
| Figure 2-4. Effect of particle size on viscosity. [27] | ||||||||||||||||||||||
| The viscosity of a rubber compound is also affected by filler content and size of the filler particles as seen in Figure 2-4. For a constant volume fraction, when the particle size is decreased, the number of particles increases together with the relative surface area, and the interparticle distance is reduced. This results in an increase in particle interaction, which will increase the viscosity of the compound as shown in Figure 2-5. The particle-particle interactions are generally weak forces, so the effect is mainly seen at low shear rates. Conversely, if the particle size is increased, the particle-particle interactions decrease and the viscosity decreases simultaneously. Furthermore, increasing the relative filler amount of the compound increases particle-particle interactions and hence increases the viscosity. [27] |
||||||||||||||||||||||
 |
||||||||||||||||||||||
| Figure 2-5. Effect of particle morphology and volume fraction of particles on viscosity. [27] Another factor influencing the viscosity of a filled compound is the filler-polymer interaction. Strong interaction between filler particles and the polymer results in immobilized polymer chains on the surface of the filler, which leads to an increase in viscosity. 2.2.1.1 Viscoelastic behaviour Under stress, the behaviour of the rubber is not purely elastic or viscous, but has the characteristics of both components. The stress level, stress amplitude and temperature determine the ratio between the viscous and elastic behaviour. At elevated temperature, the behaviour of the uncured rubber compound is viscous flow, whereas at lower temperatures both cured and uncured rubber compounds are more elastic. Factors such as temperature, filler size and filler content determine the viscoelastic behaviour as they affect both viscous and elastic behaviour. [26] The viscous component is time dependent; hence viscoelasticity is the cause of stress relaxation and creep. When a constant strain is applied to an elastomer, the force necessary to maintain that strain is not constant but decreases with time; this behaviour is called stress relaxation. Stress relaxation is caused by slippage of entanglements. Similarly, when an elastomer is subjected to a constant stress, an increase in deformation takes place with time; this behaviour is known as creep. [26] As rubber is viscoelastic, it’s response to dynamic stress is a combination of an elastic as well as a viscous response, and the energy lost in each cycle. Hence the modulus M of a rubber compound can be divided into a viscous and an elastic component. The storage modulus M’ is the elastic component which gives the energy associated with the elastic deformation and the loss modulus M” is the viscous component referring to the energy lost as heat in this process. The ratio of the loss modulus to the storage modulus is the loss tangent, tanδ. All these moduli are dependent on the frequency and amplitude of the dynamic strain or stress. [25, 26] The viscoelastic behaviour is linear when the strain is small enough and sinusoidal. When a viscous response is considered, the behaviour is not linear and stress will lag behind the strain by a phase angle of δ as shown in Fig 2-6. The tangent of the phase angle is known as the loss tangent and represents the lost energy during viscous flow. Hysteresis is the energy lost in a stress-strain cycle and correlated to tanδ. On one hand, a high hysteresis is desired for tyre applications in terms of wet grip, as it means that a high percentage of the energy is dissipated in the form of heat and not used for forward movement. On the other hand, a low tanδ implies low rolling resistance; this means that the energy input is efficiently used for forward movement. However, the temperature- and frequency regions for wet grip and rolling resistance differ: wet grip is a low temperature and high frequency effect, while rolling resistance is a high temperature end low frequency effect. [26, 28, 29] |
||||||||||||||||||||||
 |
||||||||||||||||||||||
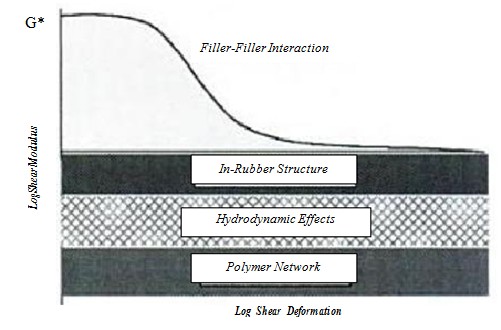
| Figure 2-6. The sinusoidal time-varying shear rate and shear stress differ in phase by the angle δ. [29] For compounds containing reinforcing fillers, the effect of the strain amplitude is larger compared to unfilled, gum compounds. It can result in a reduction of the shear modulus of as much as a factor of 4 when going from very small strains to about 10%. This is due to the breakdown of filler structure which is associated with energy losses, and is commonly called the Payne effect as shown in Fig 2-7. [28, 29] |
||||||||||||||||||||||
 |
||||||||||||||||||||||
| Figure 2-7. Model of reinforcement (Payne effect). [32] | ||||||||||||||||||||||
| 2.2.2 Natural Rubber Natural rubber is one of the most important elastomeric materials; nowadays, about half of the elastomers consumed is natural rubber. It is harvested as latex, which is a colloidal dispersion in an aqueous medium and is exuded from the Hevea brasiliensis trees. Natural rubber is nearly pure cis-1,4 polyisoprene. The rubber particles are of about 3 μm in size. The molecular weight of the polymer is normally in the range of 104-107 g/mol, depending on the age of the rubber tree, weather, method of rubber isolation and various other factors. [28, 30, 31] The rubber hydrocarbon component of commercially available natural rubber consists of over 99.99% of linear cis-1, 4-polyisoprene. The molecular weight distribution is relatively broad which offers excellent processing behaviour. The glass transition temperature of NR is about -70oC. It tends to crystallize at low temperatures and under strain. Although it has high initial viscosity, it breaks down easily to a processable viscosity. [28, 30, 31]. |
||||||||||||||||||||||
| Table 2-3 Physical constants of natural rubber [26] | ||||||||||||||||||||||

|
||||||||||||||||||||||
| The advantages of using NR are outstanding flexibility, excellent mechanical properties, good tear strength and abrasion resistance, good properties at low temperatures and low hysteresis (low heat build-up). A disadvantage is its poor aging properties. Also, NR has an average polarity that makes it compatible with a broad range of other polymers. Blends with SBR and BR are technically exploited. [30] | ||||||||||||||||||||||
| 2.3.Reinforcement of rubber | ||||||||||||||||||||||
| Reinforcement of rubber refers to the pronounced tremendous increase in tensile strength, tear resistance, abrasion resistance and modulus, taking into account the effects caused by filler particles and occlusion of rubber [32]. The compounding of rubber with different fillers helps to improve the mechanical performance of the compound. The filler morphology strongly influences the mechanical reinforcement they provide to the elastomer matrix, as do the filler surface and the different types of filler-filler and filler-polymer interactions [12]. The most important factors to influence the elastomeric reinforcement are: [32] a. Particle size or specific surface area, which together with loading determines the effective contact area between the filler and polymer matrix. b. The structure and degree of aggregation of the filler particles, which determine the physical interaction between filler and polymer. c. The type and intensity of the interaction between filler surface and polymer, which play an essential role in restrictive motion of elastomer chain under strain. d. The surface activity, which is predominant factor in filler-filler and filler- polymer interaction. |
||||||||||||||||||||||
 |
||||||||||||||||||||||
| Figure 2-8. Variation of vulcanizate properties with crosslink density. [33] | ||||||||||||||||||||||
| The physical properties of a rubber compound have a complex dependence on the crosslink system, crosslink density and type and quantity of filler. The general dependence of the physical properties on the crosslink density is represented in Fig 2-8 and the influence of reinforcing and non-reinforcing fillers is represented in Fig 2-9. The reinforcing effect of reinforcing fillers depends on the size of the aggregate, structure and surface chemistry. High structure aggregates, which consist of 100-300 primary particles, lead to a high surface area and void volume in the aggregate, which results in a stronger interaction with the rubber molecules. They can anchor in the cavities of the aggregate and adsorb to the surface. Low structure aggregates have about 30 particles and less void volume. [12, 24, 33]. |
||||||||||||||||||||||
 |
||||||||||||||||||||||
| Figure 2-9. The influence of the reinforcing filler on the properties of an elastomer. The solid line represents rubber containing a reinforcing filler whereas the dotted line represents material with a non-reinforcing filler. [66] |
||||||||||||||||||||||
| Reinforcement can be understood by evaluation of the stress softening effect measurements which is the interpretation of the complex modulus as a function of applied strain: the Payne effect as shown in Fig. 2-7. The strain-dependent part of the modulus is caused by filler networking. The increasing strain amplitude causes a drop in modulus which represents the breakdown of filler-filler networking. The final modulus remaining at high strain represents the in-rubber structure which is the combination of the structure of the filler in the rubber and the filler polymer interaction. [12, 24, 32, 33] |
||||||||||||||||||||||
| 2.4. Mixing of rubber | ||||||||||||||||||||||
| Since the discovery of vulcanization in the Nineteenth century, the use of vulcanising agents, reinforcing fillers and other additives has been a major feature of the rubber industry. Mixing of a rubber compound is a complex process and is affected by many variables. Mixing of rubber is mainly focused on achieving an even distribution and dispersion of additives, fillers and vulcanising agents in the compound, which processes well and shows an efficient cure and the required properties. Simply, in mixing it should be ensured that the mixture has a uniform composition throughout the bulk. [34, 35] |
||||||||||||||||||||||
| 2.4.1.Mixing principle | ||||||||||||||||||||||
| For mixing of rubber compounds, several basic categories of ingredients are usually distinguished: [35] |
||||||||||||||||||||||
| Table 2-4. Ingredients for rubber compounds. [35] | ||||||||||||||||||||||
|
||||||||||||||||||||||
| Rubber compounds are mixed in a single or in multiple stages. In single stage mixing, all ingredients except sulphur and other curing agents are mixed in one cycle. The curing system is added on a mill afterwards. In a multiple stage mixing, the elastomer, fillers and plasticizers are added during the first stage of mixing, and in the second stage the material is fed again into the mixing equipment for finalising dispersion and homogenation. In some cases, as in the case of silica compounds containing a coupling agent, a chemical reaction is taking place. The curing agents are added in the final mixing step, often called the productive step. In most of the cases, this is done on an open mill. Multiple stage mixing needs more time compared to single stage, but is necessary if dispersion requires intensive mixing. [34-36] For good mixing, the temperature should be controlled very well during the sequence for adding the different chemicals. To get good dispersion, fillers should be added as early as possible, so that high shear stresses can be utilised. Shear stresses are higher in the beginning of the mixing process due to higher viscosity of the polymer and the lower temperature of the compound. If fillers are added at the same time as plasticizers, or if plasticizers are added in multiple stages, the possibility of over- lubrication of the metal surfaces of the mixing chamber can be reduced. During addition of the curing agents, temperature control is very critical and mixing time is usually short. [34-36] The operating variables for mixing include ram pressure, rotor speed, fill factor, and coolant temperature. High ram pressure is useful in charging the mixing chamber, but a lower pressure is more desirable during the actual mixing. So continuous ram pressure control is required during the mixing process. A higher rotor speed leads to higher shearing forces and therefore to higher temperature. Therefore, rotor speed can be used to control the temperature of mixing. For heat sensitive compounds, low rotor speed settings are preferred. Design of the rotor and its condition also influence the mixing output: Intermeshing rotors are more effective in temperature control, and imply higher shearing forces to the material; therefore, they are in general preferred if dispersion of the filler is a crucial factor. Another factor that affects mixing is the fill factor. Usually the fill factor is between 0.6 and 0.9. For high filler loadings and high viscosity compounds, fill factors are on the lower side. The use of temperature-controlled water as coolant provides efficient transfer of heat from the compound to the mixing chamber, in order to avoid overheating of the compound as a consequence of the shearing forces. It also maintains stronger wetting of the chamber walls leading to faster and effective mixing. [24, 35, 36] |
||||||||||||||||||||||
| 2.4.2. Mixing mechanism | ||||||||||||||||||||||
| The mechanism of mixing can be studied in three stages viz incorporation, dispersion and distribution. |
||||||||||||||||||||||
| 2.4.2.1. Incorporation | ||||||||||||||||||||||
| In the incorporation stage of mixing, rubber and different additives are transformed into a cohesive and substantially incompressible mass; the rubber chains get trapped inside the agglomerates. Large filler particles are broken into smaller unities which results in a higher surface area of the fillers contributing to effective incorporation. The process of incorporation can be further divided into three stages: encapsulation, subdivision and immobilisation. [26, 34] Encapsulation is achieved in internal mixers by folding flow which occurs between the rotor and the chamber wall or in the narrow gap between the intermeshing rotors. After encapsulation, the fillers are incorporated in the rubber matrix and the mass is capable of undergoing viscous flow. Subdivision begins by breakdown of the filler agglomerates or other additives and rubber starts to achieve a uniform composition at microscopic level as a consequence of the elongation flow and shear forces. During subdivision, the dimensions of the filler unities are reduced. Immobilisation is the final step within this stage, where elastomer molecules migrate into internal voids of filler particles and thus fill the empty voids. The trapped rubber is prohibited from further flow and therefore becomes immobilised and acts as rigid filler. This process increases the viscosity of the compound and the first power peak in the internal mixer is obtained. [26, 34] |
||||||||||||||||||||||
| 2.4.2.2. Dispersion | ||||||||||||||||||||||
| After incorporation of the agglomerates, they begin to break down due to high shear forces. High shear is needed to break the filler-filler interactions. The viscosity of the compound decreases as the filler particles are subdivided and the occluded rubber is partly released. As the filler aggregates decreases in size, they also distribute more homogenously throughout the compound, but as the viscosity is reduced, dispersion becomes more difficult. Furthermore, the critical stress needed to break the smaller filler agglomerates increases during the process. [34-36] |
||||||||||||||||||||||
| 2.4.2.3. Distribution | ||||||||||||||||||||||
| The agglomerates are distributed evenly in the matrix which is achieved by elongational and shear flow. Elongational flow is more efficient but difficult to achieve in internal mixers. Distribution is a result of these flows combined with the material movement and folding in the internal mixer. Good distribution is achieved through efficient circulation of the material throughout the mixing chamber. [34-36] |
||||||||||||||||||||||
| 2.4.3. Mixing equipments | ||||||||||||||||||||||
| Mixing equipments can be divided into three groups: mills, internal mixers and continuous mixers. Continuous mixers are usually single or twin screw extruders. A mixing mill and an internal mixer are shown in Fig 2-10. [34, 36] |
||||||||||||||||||||||
 |
||||||||||||||||||||||
| Figure 2-10. Mixers used in rubber processing: A) two-roll mill and B) internal mixer. [34] |
||||||||||||||||||||||
| Twin screw mixers need the rubber to be fed in pellet like form, so rubber bales have to be grinded before they can be used; this increases the compounding cost. Twin screw mixers have less mixing variations, are easier to use and usually provide better dispersion. Mixing mills are mainly used to prepare small quantities of compounds, and for the addition of the curatives due to the better temperature control. In the mixing mills, the rubber is fed in-between two cylindrical rolls. Mixing happens when the material is forced to travel through the space between the rolls. The gap size is one of the parameters for mill mixing. A major advantage of mill mixing is the high shear developed in the gap between the rolls which facilities breaking of the agglomerates and drives incorporation of the ingredients. The disadvantages of mill mixing are: [34, 35] a. longer time of mixing, dependent on operator skills, b. dust formation when powdered additives are used, c. the difficulty in standardising the procedure and make it operator-independent, d. the difficulty in controlling batch-to-batch uniformity. |
||||||||||||||||||||||
 |
||||||||||||||||||||||
| Figure 2-11. Rotor geometry of internal mixer A) GK-E intermeshing system B) GK-N tangential system. [37] | ||||||||||||||||||||||
| In the rubber industry, internal batch mixers are most commonly used. Depending on the rotor geometry, they are classified as tangential and intermeshing mixer. In tangential mixers, as seen in Fig. 2-11, the rotors are tangential to each other providing a small gap between them. Intermeshing mixers have intermeshing rotors as shown in Fig 2-11, which need to rotate at the same speed but in opposite directions. The dispersion in the tangential rotor occurs in-between the rotor flights and the chamber wall, whereas in the intermeshing mixer it also happens in the gap between the rotors, thus enhancing the effectiveness of the dispersion. Material flow in tangential and intermeshing rotors is shown in Fig 2-12. The intermeshing mixers have a better heat flow, which is determined by the contact area between rubber and metal. The more intensive contact in an intermeshing mixer enhances heat transfer and improves temperature control. Tangential rotors produce weaker flow interactions between the rotors and the distributive mixing is not as effective as in an intermeshing mixer. Tangential mixers are relatively faster and are used for higher production rates. [34, 35, 38] |
||||||||||||||||||||||
 |
||||||||||||||||||||||
| Figure 2-12. Primary re-circulation flow paths in internal mixers A) intermeshing rotor B) tangential rotor. [26] |
||||||||||||||||||||||
| 2.5. Structures and properties of rubber-MMT nanocomposites | ||||||||||||||||||||||
| Arroyo, Lopez-Manchado and Herrero [39] prepared NR/octadecylamine modified MMT (MMT-ODA) clay nanocomposites by melt compounding. The nanofillers in the NR/MMT-ODA nanocomposites showed a partly exfoliated structure and interlayer spacing was increased. The vulcanization rate and torque increase was found to be significantly higher for NR/MMT-ODA composites compared to NR nanocomposites with unmodified MMT. The mechanical properties for 10 phr of MMT-ODA were comparable to a material containing 40 phr of carbon black. The addition of MMT drastically improved the strength of NR nanocomposites. Magaraphan and co-workers [40] prepared organoclay by modification with primary or quaternary amines containing a long hydrocarbon alkyl chain. It was found that the addition of the modified clays improved the mechanical properties of NR composites more than the addition of quaternary ammonium modified clays.Further studies [41-44] proved that even with low loadings of modified nanoclay, improved properties for NR nanocomposites can be obtained. The intercalation of the NR molecules into the gallery spaces contributes to the increase of the basal spacing between the clay layers, resulting in better polymer-filler interactions. The properties of rubber-clay nanocomposites strongly depend on the type of nanoclay, the compatibility with the polymer and the degree of dispersion. Clay in a rubber matrix can form two types of the nanocomposite structures depending on the type and modification of the clay and the method of preparation of nanocomposites: they can show an intercalated or an exfoliated structure as illustrated in Fig. 2-13. In intercalated structures, the polymer chains go in-between the galleries. The distance of separation between the silicate layers is increased to some extent, but remains relatively constant. In case of an exfoliated structure, the dispersion is homogenous throughout the polymer with random interlayer distances and orientation. The level of intercalation and exfoliation of nanoclays is very important as it determines the performance of the nanocomposites. [16, 45] |
||||||||||||||||||||||
| gambar213 | ||||||||||||||||||||||
| Figure 2-13. Schematic illustration of different types of polymer-clay nanocomposites. [6] |
||||||||||||||||||||||
| 2.6. Advantages and challenges of rubber nanocomposites |
||||||||||||||||||||||
In comparison with conventional composites, nanoreinforcement in rubber offers the a. Nanomaterials provide more effective reinforcement. A rather small fraction It is well known that the aspect ratio (ratio of the longest dimension to the shorter a. A homogenous dispersion of the nanoparticles in the matrix is crucial in order to |
||||||||||||||||||||||
| 2.7. Curing kinetics of Rubber nanocomposites | ||||||||||||||||||||||
| Vulcanization, the conversion of a plastic material to an elastic product by heat, is one of the most important process steps in the rubber industry [11]. The interest in the kinetics of vulcanization is based on the need for uniform cures in thick rubber parts such as tyres, and on the dependence of the final network on the time-temperature profile of the curing process. The kinetics of the crosslinking process is also affected by the temperature history of the compound. The advancements in computer software and simulating abilities for industrial processes have renewed interest in kinetic studies for modelling cure behaviour. [46] The cure kinetics of rubber compounds depend upon several factors such as: - composition of the rubber compound, These are the most important factors. For the analysis, optimization and control of |
||||||||||||||||||||||
| gambar214 | ||||||||||||||||||||||
| Figure 2-14. Typical curing curve. [11] | ||||||||||||||||||||||
| Several techniques can be used to characterize the curing of elastomers such as moving die rheometer (MDR), differential scanning calorimetry (DSC), infrared spectroscopy (FTIR), dynamic mechanical thermal analysis (DMTA) and advanced polymer analyser (APA). From these techniques, a parameter known as the degree of cure is defined which is subsequently plotted against time to give a useful representation of variation of cure with the time. [34] |
||||||||||||||||||||||
| 2.7.1. Models for curing kinetics | ||||||||||||||||||||||
Several researches have carried out studies of the kinetics of vulcanization of various α = Degree of cure. Value varies in the range of 0 to 1. Isayev et al. [56-57] proposed the following expression for the degree of cure: |
||||||||||||||||||||||
| rumus | ||||||||||||||||||||||
| with K(T) = Ko ∙exp (-Eo/R∙T) Kamal and Sourour [58] proposed for the rate of cure : |
||||||||||||||||||||||
| rumus | ||||||||||||||||||||||
where, K1 = A1 ∙exp (-E1/R∙T) and K2 = A2 ∙exp (-E2/R∙T) A simple model of nth order is, |
||||||||||||||||||||||
| rumus | ||||||||||||||||||||||
where K(T) = Ko∙exp (-Eo/R∙T) Many of the kinetic studies on rubber vulcanization used a simple nth order kinetic |
||||||||||||||||||||||
| 2.7.2. Theoretical considerations of a vulcanization reaction | ||||||||||||||||||||||
| In a typical vulcanization reaction, several chemical reactions with each consisting of several steps are involved. These several steps can be generalised in three steps, as shown in Figure 2-14. The first step, simply known as the induction step, is the initial step where most of the curatives undergo chemical reactions to form precursers. The second step, where the actual crosslinking occurs, consists of the formation of the network between the polymer chains. The final step involves essentially the formation of additional crosslinks leading to overcure, or to scission of earlier formed bonds leading to recversion. [59] In order to determine the kinetics of a cure reaction, the reaction steps can be quantitatively measured. These measurements can be achieved by measuring the change in stiffness of rubber compound with the help of a torque rheometer (curemeter) or by measuring the change in heat flow upon crosslinking with the help of a DSC. After the induction step, the cure reaction can be related to time and temperature through a mathematical equation. The basic equation describing the kinetic parameters for rubber curing may be given as: [59] |
||||||||||||||||||||||
| rumus5 | ||||||||||||||||||||||
| where dα/dt is the vulcanization rate, t is the time, K is the specific rate constant at temperature T and is the function corresponding to the phenomenological kinetic model. For DSC studies [52, 53], the degree of cure is defined as: |
||||||||||||||||||||||
| rumus6a | ||||||||||||||||||||||
| For curemeter studies [52,53], it is defined as: | ||||||||||||||||||||||
| rumus6b | ||||||||||||||||||||||
| where, Mo, Mt, and Mh are torque values at the time zero, at a given time of curing and at the end of crosslinking. The function K(T) in Eq. (5) is related to the activation energy by the Arrhenius equation, |
||||||||||||||||||||||
| rumus7 | ||||||||||||||||||||||
| rumus8 | ||||||||||||||||||||||
| where is the pre-exponential factor, Ea is the activation energy and R is the universal gas constant. By plotting the values of versus 1/T, the activation energy Ea can be calculated. Combining Eqs. (5) and (7), the following relationship can be obtained. |
||||||||||||||||||||||
| rumus9 | ||||||||||||||||||||||
| In curing reactions, the function may get different forms depending upon the reaction mechanism. For the nth order kinetics of the chemical reaction, is given by Borchardt and Daniels [54] as follows: |
||||||||||||||||||||||
| rumus10 | ||||||||||||||||||||||
| where n is the order of the reaction. However, for a multi-step chemical reaction, a more complex reaction model should be used to describe the kinetics. For this purpose, the autocatalytic model given by Ŝesták - Berggren [61] can be used: |
||||||||||||||||||||||
| rumus11 | ||||||||||||||||||||||
and by substituting Eq. (10) into Eq. (2), the following kinetic model can be obtained: |
||||||||||||||||||||||
| rumus11 | ||||||||||||||||||||||
| 2.7.3. Importance of curing kinetics | ||||||||||||||||||||||
| The detailed understanding of the curing mechanism is essential as it gives valuable information on how the curing reactions of heat-curable rubber compounds are progressing during the vulcanization stage. There are many alternatives to the reaction paths in commercial curing processes, but the knowledge of the mechanisms makes it possible to choose reaction conditions that favour one path over others. The mechanical properties of any rubber are dependent on the state of cure. The energy consumed during the processing and vulcanization of rubber is linked to the cost of the final end product. [47] During fabrication of the rubber compounds, the knowledge of the kinetics of crosslinking is very useful [46]. The study of cure kinetics hence can give a clear insight into the actual mechanisms of curing and its effect on mechanical properties of the end products [4]. Mainly for commercial production of the composites it is very essential to find the best curing parameters, as it will directly influence cost and effectiveness of the final end product. |
||||||||||||||||||||||
| 3. EXPERIMENTAL | ||||||||||||||||||||||
| Natural rubber nanocomposites with different types of nanoclays were manufactured and tested. In the study of the effect of different concentrations of nanofillers on the properties of the nanocomposites, only one type of filler was used. The effect of nanoclay on the curing kinetics of the compound was studied with two different modified clays. |
||||||||||||||||||||||
| 3.1. Materials | ||||||||||||||||||||||
| The polymer used in the study was Malaysian Standard Natural Rubber.. Filler materials are decribed in Table 3-1. Other materials used for compounding are stearic acid, zinc oxide (ZnO), TDAE-oil, carbon black (N-234), TMQ, CBS, sulphur, paraffine, and 6PPD. These materials were commercial grades. |
||||||||||||||||||||||
| Table 3-1. Filler materials. | ||||||||||||||||||||||
| tabel31 | ||||||||||||||||||||||
| 3.2. Compounding | ||||||||||||||||||||||
| 3.2.1. Equipment | ||||||||||||||||||||||
| Compounding of the rubber was done in a Krupp Elastomertechnik GK 1.5 laboratory mixer (see Figure 3-1) with 8 bar ram pressure. The chamber volume of the mixer is 1.5 liter. The cooling system is adjustable and mixing can be done either in automatic or in manual mode. A standard two roll mill was used for milling. |
||||||||||||||||||||||
| figure31 | ||||||||||||||||||||||
| Figure 3-1. Internal mixer and cooling. | ||||||||||||||||||||||
| 3.2.2. Recipes | ||||||||||||||||||||||
| Chemicals in powder form were weighed in cups and fillers and oils in LD-PE plastic bags. Raw materials in cups were poured directly into the mixing chamber, and bags were fed as such, after cutting off the excess part of the bag. This was possible, as the amount of LD-PE was low compared to the weight of the compound and as the bag material melted during the mixing; the fill factor used was 0.75. In the first recipe, the amount of carbon black was replaced gradually by different loadings of nanoclay, as shown in Table 3-2. Nanoclays used for the investigation are listed in Table 3-1. |
||||||||||||||||||||||
| Table 3-2. NR Recipe. | ||||||||||||||||||||||
| tabel32 | ||||||||||||||||||||||
| All the compounds were made following above formulation and changing the filler type and content. For the first part, Nanofill 5 was varied in amount along with N-234 as shown in Table 3-3. For the second part of the study, 10 phr of each type of nanofiller was used with 40 phr of carbon black. In all experiments a compound with 50 phr of CB was taken as reference. |
||||||||||||||||||||||
| Table 3-3. Filler variation for the first part of the study. | ||||||||||||||||||||||
| tabel33 | ||||||||||||||||||||||
| 3.2.3. Mixing scheme | ||||||||||||||||||||||
| For all mixing procedures, the cooling system was set to 40°C. The details of the mixing scheme can be found in Table 3-4. After mixing of the masterbatch in the internal mixer, curatives were was added to the compound on a two roll mill for approximately 15 minutes in order to get a good dispersion. Sheets of 2 mm thickness were finally made. The schematic representation of the experimental steps is shown in Figure 3-2 |
||||||||||||||||||||||
| gambar32 | ||||||||||||||||||||||
| Figure 3-2. Schematic representations of the mixing scheme. | ||||||||||||||||||||||
| Table 3-4 Mixing Scheme | ||||||||||||||||||||||
| tabel34 | ||||||||||||||||||||||
| 3.3. Test Methods | ||||||||||||||||||||||
| 3.3.1. Viscosity | ||||||||||||||||||||||
| The viscosity of the uncured rubber depends on the dispersion of the fillers. Viscosity is usually measured in a Mooney viscometer at constant shear. The viscosity changes significantly during the curing process of the rubber compound which is used to monitor the curing rate and time. Such an analysis is performed with a curemeter. |
||||||||||||||||||||||
| 3.3.1.1. Mooney Viscosity | ||||||||||||||||||||||
| The Mooney viscometer is generally used to measure the viscosity of a rubber compound before curing; as an indication of the processability of the material. It can also be used to analyse the scorchiness of a compound, by measuring the change in viscosity over time. The viscometer consists of a sealed pressurised chamber which has a serrated cavity and a serrated rotating rotor in the middle. The uncured rubber sample is placed in the temperature controlled cavity between the rotor and the chamber wall as shown in Fig. 3-3. The specimen is physically deformed by a rotating platen which will determine the change in viscosity at a preset temperature. The rotor turns at a constant rate of two revolutions per minute which creates shearing between the sample and the rotor. When the test is completed, the dies will automatically reset and allow for removal of the specimen. [25] |
||||||||||||||||||||||
| gambar33 | ||||||||||||||||||||||
| Figure 3-3. Principles of a Mooney Viscometer. [25] | ||||||||||||||||||||||
| The change of the torque is measured in Mooney units (MU), which are defined by ISO 289 and ASTM D 1646. The Mooney unites are expressed as e.g 40 ML(1+4)100oC: - 40 refers to the viscosity in Mooney units, - M refers to Mooney, - L indicates that the large rotor was used (S would be used for the small rotor), - 1 is the preheating time in minutes before the rotor is switched on, - 4 refers to the time in minutes after which the reading is taken counting from the rotor start and 100oC is the test temperature. [25] The Mooney viscosities of all samples were measured directly after milling by using a MV 2000 from Alpha Technology as shown in Figure 3-4. A large rotor was used with a test temperature of 100oC for one minute preheating time and a testing time of four minutes. |
||||||||||||||||||||||
| Gambar34 | ||||||||||||||||||||||
| Figure 3-4. MV 2000. | ||||||||||||||||||||||
| 3.3.2. Dynamic Mechanical Properties | ||||||||||||||||||||||
| Dynamical mechanical properties are used to determine the Payne effect which illustrates the quality of the dispersion. This type of measurements are also done for tyre compounds in order to estimate rolling resistance and wet grip from the hysteresis behaviour. The dynamic mechanical properties can be studied by separating them into the elastic and viscous components. As the viscoelastic behaviour of the rubber is very complex, the test results are a function of geometry of the sample, mode of deformation, amplitude and frequency of the load and test temperature. Dynamic mechanical properties can be measured by using free vibration or forced vibration of the sample. In free vibration, the sample is set into motion and its amplitude is allowed to fade via dampening, whereas in forced vibration the oscillation is maintained. An Advanced Polymer Analyser (APA) is mainly used to measure the viscoelastic properties of the raw, uncured and cured elastomers and their compounds, and a Dynamic Mechanical Analayser (DMA) is used to measure the viscoelastic properties of cured materials. [25] |
||||||||||||||||||||||
| 3.3.2.1. Advanced Polymer Analyser | ||||||||||||||||||||||
| The advanced polymer analyse (APA), which is similar to the Rubber Process Analyzer (RPA), is an advanced (dynamic mechanical rheological) test instrument, designed to measure the properties of polymers and rubber compounds before, during and after cure. The only difference between RPA and APA is that the APA can also use parallel plate dies which cool the samples more evenly than the biconical dies in RPA. Because of this, the APA is preferred for heat sensitive samples. The schematic picture of the APA die is given in Fig 3-5. [62] |
||||||||||||||||||||||
| gambar35 | ||||||||||||||||||||||
| Figure 3-5. Die configuration of the APA 2000. [63] | ||||||||||||||||||||||
| The RPA applies strain between 0.3-1250 percent to the sample by using a sinusoidally oscillating lower disc. The oscillation frequency can vary between 0.02 to 50 Hz. A sample in the RPA can be tested upto the maximum temperature of 230°C. High strain testing is possible because of the sealed highly pressurised cavity of the RPA which can test the rubber specimen at a pressure of at least 2.76 MPa. By using forced air cooling, the temperature of the system can be dropped rapidly by 1°C per second. Moreover, different subtests such as controlled strain or controlled stress, isothermal cure, non-isothermal cure, frequency sweep, strain sweep, temperature sweep and stress relaxation can be performed for a rubber sample. [25, 62] The complex torque S* transmitted through the sample is measured by the torque transducer in the upper die, which is further processed by the software to separate it into an elastic component S’ and a viscous component S”. The elastic component is in phase with the strain, whereas the viscous component is 90o out of phase. The obtained values are processed to calculate the shear modulus G, the storage shear modulus G’ and the loss shear modulus G”. The dynamic real viscosity η’ can be calculated by dividing the loss modulus by the applied frequency ω in radians. [25, 62] The rheological measurements for the samples are performed in an Advanced Polymer Analyser, APA 2000, from Alpha Technologies. The tests were carried out one day after milling so that the compounds could stabilize. Measurements were done threefold. Strain sweep measurements were performed for the first samples at 150oC and a test time of 20 minutes. |
||||||||||||||||||||||
| 3.3.3. Curing Characteristics | ||||||||||||||||||||||
| The curing process of a rubber compound can be divided into two main stages: the heating stage up to the temperature at which the cure reaction starts, and the cure reaction itself. Although the heating stage is rather simple to describe, the curing stage of rubber is a complex reaction with initiation steps, followed by propagation steps, and ending in termination steps. Reduction of these complex steps into a unique and simple reaction leads to an Arrhenius’s equation as described in the previous chapter. The Arrhenius’s expression leads to a single value of an energy of activation for a given order of reaction. [64] For characterization of the curing process, the rubber material is heated to a narrow temperature window within which the cure reaction proceeds. The parameters of the curing process have to be well chosen, as the quality of the final material depends on the cure process. The curing characteristics can be studied in a Moving Die Rheometer (MDR), a Rubber Process Analyser (RPA) or an Advanced Polymer Analyser (APA). Whatever the instrumentation selected for the study purpose, the state of cure at time t is the value of the mechanical property attained at time t as a fraction of the maximal value of the corresponding property. Also, the cure reaction is slightly exothermic and hence the various profiles of temperature and of state of cure are dependent on the mass of the rubber. [64] The curing characteristics for the samples were studied by using the Advanced Polymer Analyser, APA 2000, from Alpha Technologies. The tests were carried out a day after milling so that the compounds had time to equilibrate. All measurements were done three times for each compound. With a programmed temperature profile, a temperature sweep was done for the samples during 1 hour. The temperature profiles were set to three different temperatures profiles viz 140, 150 and 160 degrees for temperature sweep measurements. |
||||||||||||||||||||||
| 3.3.4. Mechanical Properties | ||||||||||||||||||||||
| Mechanical properties basically define the stiffness and strength of the material. Modifiers and fillers are used to strengthen the properties of the rubber. Restricting the molecular movement helps to vary hardness, elasticity and strength of rubber. Tensile tests and hardness are the most commonly performed mechanical tests for rubber compounds. |
||||||||||||||||||||||
| 3.3.4.1. Tensile properties | ||||||||||||||||||||||
| The strength properties of a rubber compound are used as a general indicator of the quality of the rubber compounds. Tensile strength, elongation at break and tensile stress at a certain elongation are the main measured properties. These properties are dependent on the geometry of the sample and the strain rate. For a tensile test, the sample usually is dumbbell-shaped with specified dimensions. The modulus for rubber samples is defined as the tensile stress at a given elongation which is usually 100%, 200%, 300% and 600%. Standardised tensile tests are defined by ISO 37 and ASTM D 412. From tensile tests, a lot of information can be obtained. Poor dispersion of the filler materials lowers the tensile strength of the material. An overconcentration of the curative content or excessive accelerator in the compound can lead to a reduction of the strength. Over-processed compounds will have a decreased modulus. Additionally, a low tensile strength can be the outcome of an incomplete curing reaction or a deficiency in curatives, short curing time or low curing temperature and poor dispersion of the curatives. [25, 62] The mechanical properties of the different samples were measured in a tensile test with specimen type 1 defined in SFS ISO 37. Tensile tests were done by using a Monsanto Tensometer 10 at a rate of the transverse of 500 mm/min. |
||||||||||||||||||||||
| 3.3.4.2. Hardness | ||||||||||||||||||||||
| The hardness test measures the resistance of the material to a small rigid object pressed onto the surface at certain force. The hardness of the rubber is usually expressed in Shore A units or in International Rubber Hardness Degrees (IRHD). The hardness measurements can be done quickly by using different kinds of durometers, but they show a large uncertainty of up to 5 units. For hard rubber, the Shore D scale is used. Usually, hand held durometers which generate force using a spring, are used. These are usually less accurate and have poorer reproducibility compared to the mounted dead load durometers, which are equipped with a mass that produces the required force. When using hand held durometers, the results are affected by how quickly the durometer is pressed onto the surface of the rubber. The measuring standards include ISO 48, ASTM D 1415, ASTM D 531 and ASTM D 2240. [25, 62] The hardness tests of the samples were done according to ASTM D 2240 and by a hand held durometer AFRI Hardness Tester. To ensure a sample thickness of at least 6 mm, three sheets of rubber were used. All tests were performed under normal laboratory conditions, and measurements were noted for 3 and 15 seconds. |
||||||||||||||||||||||
| 4. RESULTS AND DISCUSSION | ||||||||||||||||||||||
| 4.1. X-ray diffraction of the compounds | ||||||||||||||||||||||
| X-ray diffraction (XRD) analysis was carried out to investigate the effectiveness of the clay intercalation and the change in intergallery distances of the clay in the composite. Cu-Kα radiation (λ= 0.154056 nm) was used as a source. The interlayer distance of the clay in the composites was calculated from the (001) lattice plane diffraction peak using Bragg’s equation. The obtained XRD patterns of the compounds are represented in Figure 4-1. One sharp peak was found for both clay filled compounds towards the low angle. This is due to presence of the crystallites of the corresponding modification in the clay structure. The first maximum peak for the NR-CB-Nanofill 5 sample was obtained at an angle of 2.39 degrees, and for the NR-CB-nanoclay 682616, the peak was obtained at 2.32 degrees as can be seen from Figure 4.1-1. Further calculation of the plane spacing using Bragg’s law results in a value for the compound with Nanofill 5 of 3.71 nm, and for Nanoclay 682616 a spacing of 3.81 nm was calculated. As expected, these spacings are higher compared to the initial planar spacing of the unmodified MMT clay which is in the range of 1.32 nm, and to the quaternary ammonium modification which results in a spacing in the range of 2.98 nm [65]. However, no difference is found depending on the modifying agent, though they differ significantly in chemical nature and molecular dimensions. |
||||||||||||||||||||||
| gambar41 | ||||||||||||||||||||||
| Figure 4-1. XRD patterns of nanoclay filled rubber compounds with reference to the carbon black filled rubber compound. |
||||||||||||||||||||||
| .2. Effect of nanoclay loading variation | ||||||||||||||||||||||
| The effect of the nanoclay loading variation on the material properties was studied with Nanofill® 5 clay. |
||||||||||||||||||||||
| 4.2.1. Mooney Viscosity | ||||||||||||||||||||||
| In order to understand the effect of the clay loading on the viscosity of the rubber-clay compounds, the Mooney viscosities were measured, and the results are shown in Figure 4-2. Every compound was measured three times before and after addition of the curing agents, and the average of the three measurements is plotted. For both clays, an initial decrease of viscosity is found, followed by an increase for higher loadings. The initial decrease in viscosity might be caused by the replacement of carbon black by well- dispersed clay. However, at a certain concentration, the nanofiller is no longer well dispersed, leading to an increase in viscosity at higher nanofiller loadings. A well dispersed compound will always have a lower viscosity and higher die swell than a comparable compound that is less dispersed. |
||||||||||||||||||||||
| gambar42 | ||||||||||||||||||||||
| Figure 4-2. Mooney viscosity of rubber compounds before and after addition of curing agents. |
||||||||||||||||||||||
| 4.2.2. Dynamic properties measured in strain sweep | ||||||||||||||||||||||
| The strain sweep analysis of the rubber compounds was performed to investigate the filler-filler networks. The dependence of the dynamic properties on the strain amplitude at low deformation can give a better understanding of the filler-filler networks in a rubber matrix. The properties of uncured as well as cured compounds are influenced by polymer-filler and filler-filler interactions. The modulus values for the filled rubber systems depend significantly on strain as explained in Figure 4-3 shows the storage modulus G’ for the samples as a function of strain. The Payne effect is decreasing with increasing nanoclay content. This is an indication that the carbon black has a higher filler-filler interaction than the modified clay; therefore the replacement of carbon black by clay results in a lower modulus at low strains. Additionally, the presence of the clay might induce a better dispersion of carbon black as well. The presence of only 1phr of nanoclay reduced the Payne effect overproportionally: from 160 kPa it decreases to 120 kPa. This is in accordance with earlier measurements [67], in which a small amount of nanofiller has a significant effect on properties. Another step is found between 5 and 10 phr of nanoclay, where the storage modulus decreases to 80 kPa; the nature of this incontinuity is unclear. |
||||||||||||||||||||||
| gambar43 | ||||||||||||||||||||||
| Figure 4-3. Storage moduli of the rubber compounds as a function of nanoclay loading. | ||||||||||||||||||||||
| 4.2.3. Curing characteristics | ||||||||||||||||||||||
| In order to explore the curing behaviour as a function of the nanoclay loading, the curing characteristics were studied. The results are given in Figure 4-4 and Table 4-1, and they show that the curing time decreases with increasing clay content. The scorch time is decreasing with increasing clay content. The decrease in curing and scorch time can be explained on the basis of the modification of the clay. The modification agent of the clay contains ammonium compounds, and the commonly used and most effective accelerators are also nitrogen-compounds. Therefore, the ammonium group of the clay modifier might take part in the amine complexion reaction and thus facilitate the curing reaction of natural rubber. A decrease of the maximum torque is observed for increasing nanoclay concentrations: the maximum torque of the compound with 15 phr clay is roughly halfway of the maximum of the compound without clay. The presence of the clay shows a deactivating effect in terms of curing. One explanation for this phenomenon might be an adsorption of the curatives onto the surface of the clay filler, especially on fresh surfaces from aggregates and agglomerates which were broken during mixing. These curing additives are immobilised and inactivated on the surface of the filler. |
||||||||||||||||||||||
| Table 4-1 Nanoclay loading and cure characteristics | ||||||||||||||||||||||
| tabel41 | ||||||||||||||||||||||
| gambar44 | ||||||||||||||||||||||
| Figure 4-4. Curing curves of different NR-CB-Nanofill5 compounds. | ||||||||||||||||||||||
| 4.2.4. Mechanical properties | ||||||||||||||||||||||
| 4.2.4.1. Hardness | ||||||||||||||||||||||
| The hardness of the materials with different nanoclay loadings is presented in Figure 4- 5. There is no significant variation in the hardness level as a function of the filler loading. |
||||||||||||||||||||||
| gambar45 | ||||||||||||||||||||||
| Figure 4-5. Hardness of rubber compounds as a function of nanoclay loading | ||||||||||||||||||||||
| 4.2.4.2. Tensile strength | ||||||||||||||||||||||
| The tensile strength of the cured materials as a function of the nanoclay loading is given in Figure 4-6. It shows that the final strength is slightly decreasing with increasing clay loadings. However, up to a concentration of about 3 phr of clay, the strength is more or less constant. The decrease in strength at higher concentrations is probably caused by insufficient filler dispersion, as also seen in the viscosity values. |
||||||||||||||||||||||
| gambar46 | ||||||||||||||||||||||
| Figure 4-6. Tensile strength for different nanoclay loading. | ||||||||||||||||||||||
| 4.2.4.3. Elongation at break | ||||||||||||||||||||||
| The elongation at break values follow the same pattern as the tensile strength, as can be seen in Figure 4-7. The decrease in elongation at break therefore is also reduced due to the lower degree of dispersion. Looking at the stress strain properties as a whole, it seems as if the property changes due to the reduction in carbon black content are partly balanced by the addition of the nanofiller. The nanoclay has a reinforcing effect, but it is less than expected from a nanosized material with a high aspect ratio. |
||||||||||||||||||||||
| gambar47 | ||||||||||||||||||||||
| Figure 4-7. Elongation at break for different of nanoclay loading. | ||||||||||||||||||||||
| 4.2.5. Conclusions | ||||||||||||||||||||||
| When a part of the carbon black is replaced by an ammonium-modified nanoclay, the scorch time is reduced, as is the curing time and the maximum torque. The presence of clay has an activating effect for the onset of the curing reaction: it starts earlier the higher the clay loading. The curing times are also shorter, but this is mainly caused by the low torque increase; the curing rates decrease with increasing clay loading. The stress strain properties within this study are slightly reduced for higher loadings: The reinforcing effect of the clay is not higher than the reinforcing effect of carbon black. |
||||||||||||||||||||||
| 4.3. Curing kinetics and activation energy | ||||||||||||||||||||||
| 4.3.1. Curing kinetics | ||||||||||||||||||||||
| gambar48 | ||||||||||||||||||||||
| Figure 4-8. Curing curves of different rubber compounds at a) 140oC, b) 150oC, and c) 160oC. |
||||||||||||||||||||||
| The effect replacing 10 phr of CB by nanoclay is shown in Figure 4-8. As reference material, the compound with 50 phr carbon is used. When 10 phr of carbon black is replaced by clay, both minimum and maximum torques alter significantly: both values are reduced, resulting in a lower torque change during curing. The temperature sensitivity for all three materials is comparable: at 140oC, the degree of curing is rather stable, while at 160oC, reversion occurs. The presence of clay does not make a difference for this trend. The same curves are represented in Figure 4-9, but now showing the influence of temperature. These curves also show clearly the effect of temperature on the thermal stability of the material: the higher the curing temperature, the more pronounced the reversion. Additionally, with increasing temperature, the scorch time is reduced as well as the maximum torques are reduced. This was expected, as the crosslinking reaction starts and proceeds faster, and therefore the network is less well developed. |
||||||||||||||||||||||
| gambar49 | ||||||||||||||||||||||
| Figure 4-9. Rheometric curing curves of rubber compounds at different temperatures a) NR-CB b) NR-CB-Nanofill 5 and c) NR-CB-Nanoclay 682616. |
||||||||||||||||||||||
| gambar410 | ||||||||||||||||||||||
| Figure 4-10. Rate of conversion (dα/dt) versus the degree of conversion of three different rubber compounds at 140 oC a) NR-CB b) NR-CB-Nanofill 5 c) NR-CB- Nanoclay 682616. |
||||||||||||||||||||||
Figure 4-11 gives an overview of the kinetics of vulcanization as a function of |
||||||||||||||||||||||
| gambar411 | ||||||||||||||||||||||
| Figure 4-11. The rate of conversion (dα/dt) versus the degree of conversion of a) NR- CB b) NR-CB-Nanofill 5 c) NR-CB-Nanoclay 682616 at three different temperatures. |
||||||||||||||||||||||
| 4.3.2. Activation energy | ||||||||||||||||||||||
| Different kinetic parameters of the vulcanization reaction of the three different rubber compounds were determined from the data given above and are tabulated in Table 4-2. The values of the specific rate constant (K), and the order of reaction,: a and b, are calculated through a non-linear multiple regression analysis from the experimental data. Furthermore, an Arrhenius type plot of lnK versus 1/T is drawn, from which the activation energy of vulcanization (Ea) can be calculated, as shown in Figure 4-12. The activation energy is an indication of the ease of the crosslinking process. The slope of the straight line in the plot of lnK versus 1/T gives the activation energies for the different compound types. |
||||||||||||||||||||||
| gambar 412 | ||||||||||||||||||||||
| Figure 4-12. Arrhenius type plot of lnK versus 1/T for the calculation of the activation energy. |
||||||||||||||||||||||
| The activation energy of the different compounds is shown in Table 4-2. The clay containing compounds have lower activation energy compared to NR-CB compound. The decrease in activation energy can be caused by the filler or by the amine compound which is used for the modification. However, the network formation is easier when the clays are added which is clearly seen with faster curing rates as calculated previously. |
||||||||||||||||||||||
| Table 4-2. Different kinetic parameters and activation energy of the rubber compounds. | ||||||||||||||||||||||
| tabel42 | ||||||||||||||||||||||
| 5. OVERALL CONCLUSIONS | ||||||||||||||||||||||
| The first main aim of this study was to understand the effect of different nanoclay loadings on the properties of natural rubber nanocomposites in terms of processing, curing and final properties. In the second part, the curing kinetics and activation energies for two different types of modified clays are investigated. Two different types of modified clays were selected: Nanofill 5 and Nanoclay 682616. Both clays are modified with a nitrogen-containing compound; the first one with a ammonium salt and the second with an amine. In the first part, the effect of variation of the loading was studied by using Nanofil 5. Changes were found in the viscosity of the compounds, which very likely were caused by dispersion problems at higher loadings of the nanoclay. The curing behaviour was also affected: scorch time and curing time were shortened, and the torque increase was reduced. The curing time for the 15 phr clay containing compound was reduced to 5.89 minutes; the pure carbon black compound had a cure time of 10.90 minutes. Both effects can be explained by an activating effect of the clay modification agents on the curing reaction on one hand, and by immobilization and thus inactivation of curing additives on the surface of the clays on the other hand. The ammonium groups of the modification agent of nanoclay facilitate the curing reaction of natural rubber, as they act as accelerators in the curing process. Furthermore, the plasticisation effect of the clay reduces the torque values, and this effect was more pronounced for higher clay contents. However, the tensile strength did not increase as expected for the addition of nanofillers. The accomplishment of a high degree of intercalation and exfoliation of layered clay minerals is a major issue for rubber nanocomposites. A successful approach of intercalation of the modified nanoclay by the polymer is demonstrated in this investigation. An increased interlayer distance of the modified clay in the compound was found, which arises from effective decrement of attraction between the clay mineral platelets. XRD results confirmed that there was significant intercalation. The plane spacing of the nanoclay containing compounds showed a significant increase from an average value of 2.6 nm to 3.7 nm for Nanofill 5 and 3.8 nm for Nanoclay 682616. This intercalation very likely resulted from strong interactions between NR and MMT promoted by the modifications. A strong influence of the expanded clay on the curing activity was found in the curing study of the nanocomposites. The expansion of the interlayer spacing facilitates penetration of the large macromolecular chains into the layers which further aids in dispersion. Mooney viscosity results showed that the replacement of carbon black with modified nanoclay can help in dispersion of the fillers. The dynamic mechanical analysis in a strain sweep analysis of the rubber compounds showed the layered clay induced dispersion of carbon black. Also, strong interactions between carbon black, nanoclay and natural rubber matrix were found. The partial replacement of carbon black with nanoclay influences the curing behaviour substantially. With addition of 10 phr clay, both minimum and maximum torque has alterated significantly, which can be attributed to the clay-rubber interactions including intercalation and exfoliation of the clay particles. The effect of nanoclay on the cure kinetics can also be attributed to the presence of other vulcanizating ingredients such as sulphur and accelerators added during the vulcanization. The curing mechanism is temperature dependent as the curing time is reduced with increase in curing temperature. This is due to the availability of more thermal energy for the cure reaction. To get a better understanding of the curing mechanism, the kinetic parameters of the vulcanization reaction of the rubber compounds were calculated. They show that the addition of clay significantly decreases the activation energy. Based on the results obtained in this study, further investigation is necessary for understanding the curing kinetics of the compounds. A more detailed study is quite essential in order to understand the mechanisms related to the presence of the clays. Future research within a broader temperature window, with different clay modifications and different carbon black types would be the next step of another study. Further studies on the curing kinetics of the nanoclay filled rubber compounds and further development of the nanoclay technology is recommended to utilize the full potential of the nanoclay modification for rubber nanocomposites. |
||||||||||||||||||||||
| REFERENCES | ||||||||||||||||||||||
|
R. L. Fan, Y. Zhang, C. Huang et al, Simulation and verification for sulphur |
||||||||||||||||||||||
Senin, 28 Maret 2016
Influence of Clay Modification on Curing Kinetics of Natural Rubber Nanocomposites
Langganan:
Komentar (Atom)